I used to proudly proclaim the reliability of my previous aircraft exactly as given in the Gulfstream sales brochures: “the G450’s dispatch reliability rate is 99.7%” I wrote up our second missed trip in that jet on our 600th flight log, back in the days we used paper for these things. If you do the math, 2 out of 600 comes to 0.3%. More to the point, we made 598 trips out of 600 attempts, matching the 99.7% claim.
But when my current aircraft, a Gulfstream GVII, had temporary fleetwide restrictions placed on it for anti-icing and later for the impact of winds on the fly-by-wire system, none of those missed trips counted against the aircraft’s record. They were weather problems, you see, not aircraft problems. This isn’t a Gulfstream issue; the entire industry plays these statistical shenanigans. It is more a problem with how we perceive reliability. And this problem impacts the way we aviators accept risk. If you judge your actions based on probabilities measured by decimal points beyond 99, you might be accepting more risk than you should.
When I started flying jets in 1979, reliability statistics were almost entirely a matter of the aircraft’s mechanical fitness to fly. If the parts worked, you flew. My first jet was the Cessna T-37 “Tweet,” which I flew as a student and later as a qualified Air Force pilot. The Tweet was almost entirely mechanical. The only electronics involved were for the radios, lights and a few other basics. The flight controls were nothing but a control stick and mechanical linkages like cables, pulleys and hinges.
What could possibly go wrong? A fellow student that year found out. He found himself on a solo flight with a control stick stuck full right while practicing an aileron roll. This pilot had two things working in his favor: 15,000 ft. of altitude and a quick mind. He realized that something must have wedged itself somewhere between the stick and an aileron, so he pushed the nose over for as much negative-G as he could tolerate. That freed a ballpoint pen wedged into the stick pivot hinge through a hole in the leather boot designed to prevent this kind of interference.
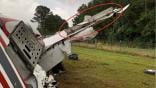
With many mechanical failures, like the hole in the stick boot, the path from unreliable to trustworthy is easily mapped. You can predict material failure, you can improve inspection protocols, you can come up with a better mousetrap. In the old days, when presented with aircraft wreckage, investigators could invariably find the “Golden BB,” the cause of it all. Aircraft reliability was easily understood by pilots and mechanics. Aircraft became more reliable as the aviation industry became smarter. But these days our aircraft are so much more than cables and pulleys and predicting failures has become the realm of experts.
Experts Aren’t

Aircraft have become so complicated that it is only natural that we as operators must assume much of what we read in our manuals must be true because it came from “the experts.” Consider, for example, the safety record of the Space Shuttle. We were told early on by NASA experts that the chance of an accident was 1 in 100,000, pretty good odds. After the loss of Challenger in 1986, we found out that the line engineers in the solid rocket booster program thought the rate would be 1 in 100, but by the time these numbers were filtered through NASA management, the risk was considerably diluted. The actual rate? Of 135 launches, there were 2 losses.
Why Reliability Math Doesn’t Work
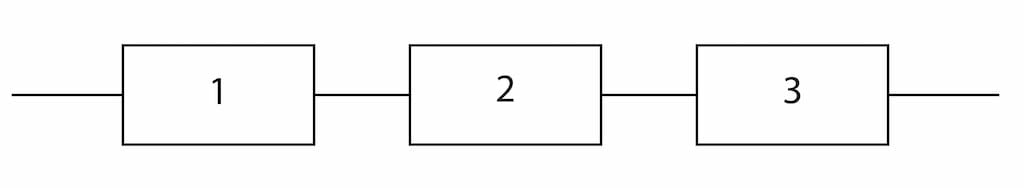
How do you discern between fantasy, such as the 1-in-100,000 prediction, and reality? As with many things in life, it starts with math. To get a grasp on how complicated this can be, consider a very simple transportation device, a bicycle. You could break down the components into just three things: two wheels, two pedals and the handlebars. If any of these three components break, you are theoretically done. From a reliability point of view, this is a series system where everything has to work for the entire system to work.
Of course, there are more components to a bicycle than just these three. You could add the sprockets and chain between the pedals and wheels, for example. But let’s keep it simple for now. You compute the overall reliability by multiplying the individual reliability of each component, which we’ll rate from zero (completely unreliable) to one (completely reliable). So Rbicycle = Rwheels x Rpedals x Rhandlebars. If the wheels are rated at 0.7 (they are known to go flat now and then), the pedals at 0.99 (they rarely fail), and the handlebars at 0.9 (they are also very reliable, we can predict the bicycle will be reliable at a rate of 0.7 x 0.99 x 0.9 = 0.624, or about 63%. But does a flat tire render the bicycle completely unusable? We have systems within the system, and some of these are better classified as parallel.
Probability Of Failure
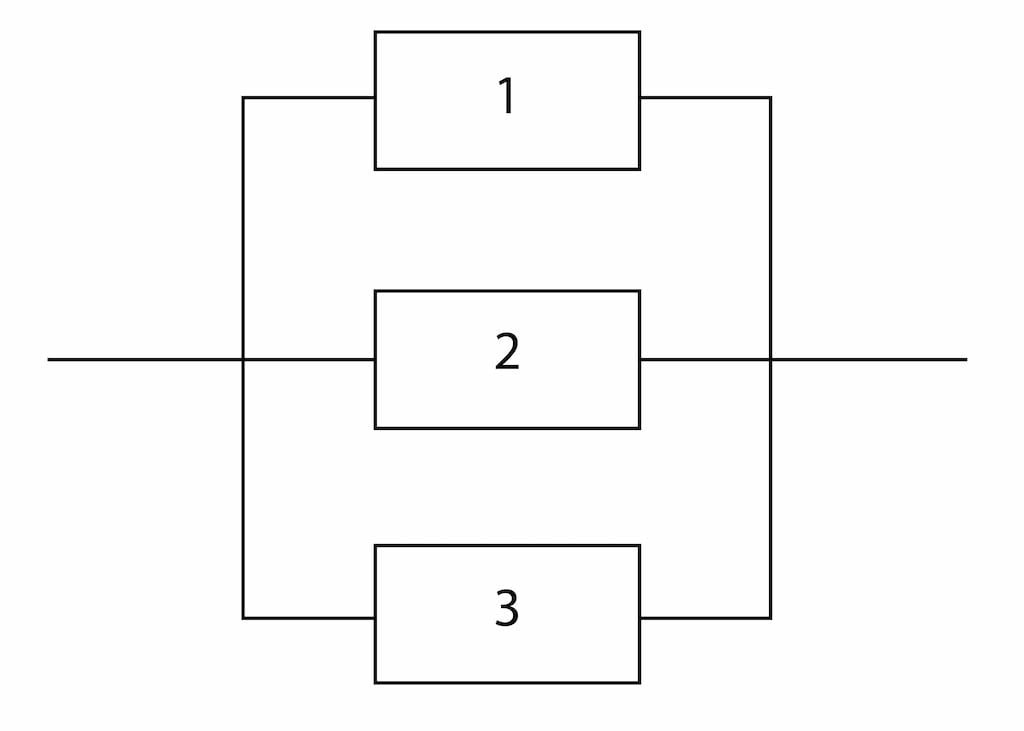
We can see that the “wheel system” is made up of at least three inner systems: a metal wheel, a rubber tire and an innertube. A nail in the rubber tire can certainly cause the innertube to fail, but you could continue to ride if it was more important to get to where you were going than to prevent any further damage. Saying the bicycle is only 63% reliable becomes a meaningless statistic. One of the problems with math and statistics, is that you can dress them up so those not versed in either can be duped by both. We can dress up our probability of failure with impressive formulas:
R=R1 × R2 × R3 ×...× RN=ΠRJ
and
F=1-R
where
R is the overall reliability rate
R1 is the reliability rate of component number 1, and so on
RN is the reliability rate of the last component
ΠRJ is the product of all the reliability rates
F is the probability of failure
And this is for a series system, the easier to consider. The math for a parallel system gets more complicated and when you start blending series and parallel systems, the math gets more complicated still.
You could ask, for example, “What is the probability of failure of my angle of attack system?”
“Well, that depends,” says the expert. “There are at least 100 individual components to consider, each with their own probabilities. But rest assured, we did the math, and we think the chances of a total failure of your AOA system is one in a million.”
I think it is safe to say that if anyone gives you a probability of failure that ends with “in a million,” they don’t know what they are talking about. Our perception of reliability is not only colored by “fuzzy” math, but we are also creatures of how we grow up dealing with mechanical and other tangible objects.
In Part 2 of this article, we consider the reliability ‘bathtub’ curve.

Related Content